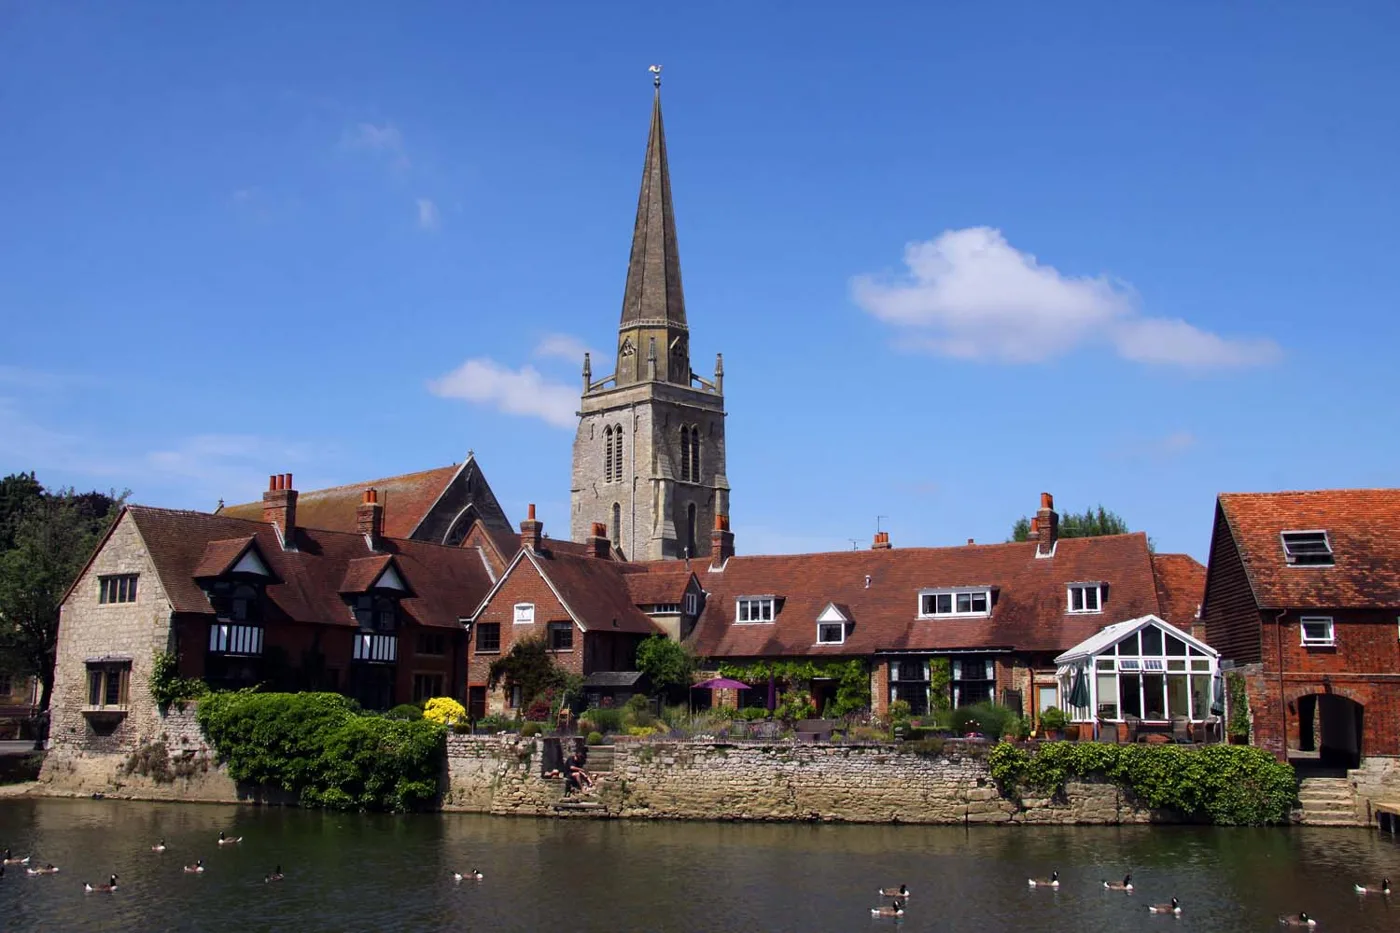
The average Vale home reached £414,441 in June, up 6.3% and the fastest rise of Oxfordshire's five districts. Oxford and West Oxfordshire prices both fell.
The average home in the Vale of White Horse sold for £414,441 in June 2026, £24,517 more than a year earlier. That is a rise of 6.3%, and it is the fastest of Oxfordshire’s five districts.
The figures come from the UK House Price Index, published by HM Land Registry on 19 August. It is built from completed sales lodged with the Land Registry, so it lags the market by a couple of months but records what buyers actually paid.
The Vale rose while Oxford fell
Two of the county’s five districts lost value over the same twelve months, and one of them is the city next door.
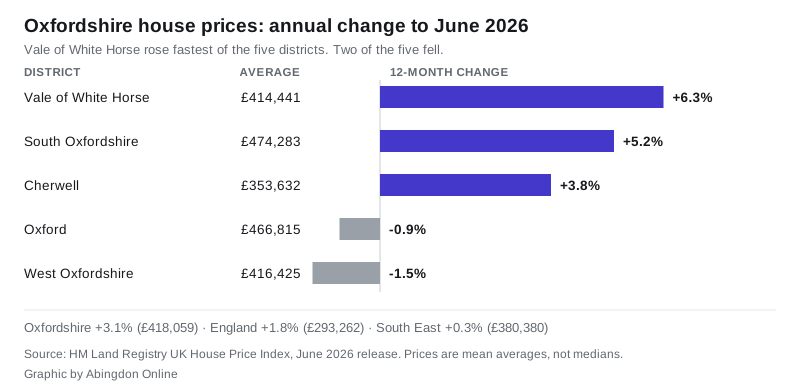
Ranked by annual change:
- Vale of White Horse: +6.3%, average £414,441
- South Oxfordshire: +5.2%, average £474,283
- Cherwell: +3.8%, average £353,632
- Oxford: -0.9%, average £466,815
- West Oxfordshire: -1.5%, average £416,425
The gap between the Vale and the city is the striking part. Oxford’s average is still £52,374 higher than the Vale’s, but it slipped by £4,177 over the year while the Vale added £24,517.
The wider comparisons make the Vale look stronger still. Oxfordshire as a whole rose 3.1%. England rose 1.8%. The South East rose 0.3%, which in cash terms is £1,118 on an average home. The Vale added more than twenty times that.
Set against all 295 local authority districts in England, the Vale had the 42nd highest annual increase. A year earlier it ranked 51st. In the June figures 233 English districts rose and 62 fell.
The middle of the market is doing the work
Split by property type, the biggest rises are not at the top end:
| Type | Average, June 2026 | Annual change |
|---|---|---|
| Detached | £672,548 | +5.8% |
| Semi-detached | £404,362 | +7.3% |
| Terraced | £326,204 | +7.2% |
| Flat | £208,029 | +4.1% |
Semi-detached and terraced homes are rising faster than detached houses, and flats are rising slowest. That is the pattern of a market where the pressure is on family homes at ordinary prices rather than on the largest properties.
The average paid by a first-time buyer in the district was £332,397, up 6.7%.
Two things to hold in mind
This is a mean, not a median. The UK House Price Index reports the average of all sales, so a handful of expensive completions can lift it. A median, which takes the middle sale, would sit lower. Anyone reading £414,441 as “what a house in Abingdon costs” is reading it wrong twice over, because the district also covers Wantage, Grove, Faringdon, Botley, Radley and the villages along the Ock and the Thames. Those are several different markets averaged into one number.
The figures get revised, in both directions. May 2026 was first published as £407,966, a rise of 3.6%. In this month’s file it reads £410,842 and 4.3%. April moved the other way, from £410,036 down to £408,862. A single month’s number is provisional until several releases have passed over it.
Fewer sales, but be careful with that comparison
The Land Registry recorded 2,003 sales in the Vale in the year to April 2026, against 2,508 in the year to April 2025. Sales volumes are always about three months behind the price data, so April is the latest month that can be quoted.
That looks like a sharp drop, and it is not really one. The earlier window contains the rush to complete before the stamp duty threshold changed on 1 April 2025. The Vale recorded 377 sales in March 2025 and 81 in April 2025. The same two months of 2026 were 114 and 104. The 2025 total was inflated by transactions that would otherwise have happened later.
What it means for you
If you are selling, the index says demand held up through the year in the Vale while it did not in Oxford or West Oxfordshire. Semi-detached and terraced sellers are in the strongest part of the market.
If you are buying, the first-time buyer average of £332,397 is up £21,008 on June 2025, which is real money against a deposit. Flats rose slowest at 4.1% and are the only type where the Vale gap to Oxford is wide: £208,029 here against £285,194 in the city.
If you are checking your own street, the district average will not tell you much. Our Abingdon house prices page sets the district figure against rolling-year sold prices for the town itself, which is closer to what a specific address is worth.
If you are watching supply, the district’s planning decisions are the other half of this picture. The number that moves prices over years is how many homes get built, not how many change hands in a month.
The next release, covering July 2026, is due on 16 September.
Sources
- HM Land Registry UK House Price Index, Vale of White Horse, June 2026 for the district’s average price, annual change, type splits and first-time buyer average.
- UK House Price Index full data file, June 2026 for the comparison with the other Oxfordshire districts, the England and South East figures, the sales volumes and the ranking against all 295 English local authority districts.
- UK House Price Index full data file, May 2026 for the figures as first published, used for the revisions.
- UK House Price Index reports for the release schedule and methodology.
Have your say
We read every message. To comment on this story, email the newsdesk and we may publish a selection of responses: hello@abingdononline.co.uk.